When you generate new online leads, you’ll want to keep forms minimal to maximize conversions.
But when you customize your sales messages and analyze lead sources, you’ll want to use as many data points as possible.
The answer to this dilemma? Data enrichment, or capturing data about leads without asking them to submit it.
Data enrichment can be done manually by someone on your team, using tools and scrapers you build yourself or using third-party tools.
We at Outfunnel get hundreds of new trials each month and we analyze tens of thousands of new potential leads for our outreach campaigns, so manual work is not practical. And although we have a strong tech team, we’d like them to focus on building the product. So we’re using Clearbit to enrich data of all new signups in our CRM as well as Builtwith for improving our targeting for outreach campaigns.
What enrichment data we’re capturing with Clearbit
Clearbit offers a wide range of data points but since each additional unit of data comes at direct or indirect costs, we’re capturing a subset in our CRM (Pipedrive) for all new leads/ contacts:
- Industry
- Company description
- Location / address
- Employee count
- Annual revenue
- Alexa rank
- Tech tags (tools and technologies that are connected to their domain)
We’ve had Clearbit data synced to Pipedrive for a couple of years already to have more context about leads when we interact with them. It’s useful to be able to see where a company is located when you write an email to them, for example.
We recently also removed the company name from the sign-up form to make the process smoother, and use Clearbit to fetch the company name.
But we never ran the numbers to see how accurate and useful Clearbit data is. Until now, that is.
How to define the accuracy and “usefulness” of data enrichment?
One way is to measure each variable against a key business metric like conversion to paid.
Our conversion from free trial to paid is roughly 17%. So if we can identify variables that correlate with much higher or lower conversions than that, we can consider that variable accurate and/or useful.
If we learned that users from a particular industry, country, or employee size bracket converted to paid really well, we could prioritize these segments in marketing and deprioritize others, and meaningfully increase the effectiveness of marketing, right?
The sample of companies we used in this analysis is approx. 8300 recent leads.
How useful is enriching leads with country data (from Clearbit)?
First, we looked at location data that Clearbit had about our leads. Out of approximately 8000 companies analyzed, Clearbit provided a value about nearly 5000 of them.
When we plot conversion by country, the result looks pretty telling at first glance.
There seem to be big differences in conversion to paid between signups from different countries. And intuitively, the data makes sense at first glance, with countries with high use of SaaS tools and web payments at the top and India at the bottom. But Spain converting higher than the US and the Philippines higher than Ireland?
Perhaps we should strip countries with fewer than 50 companies/data points from the calculation?
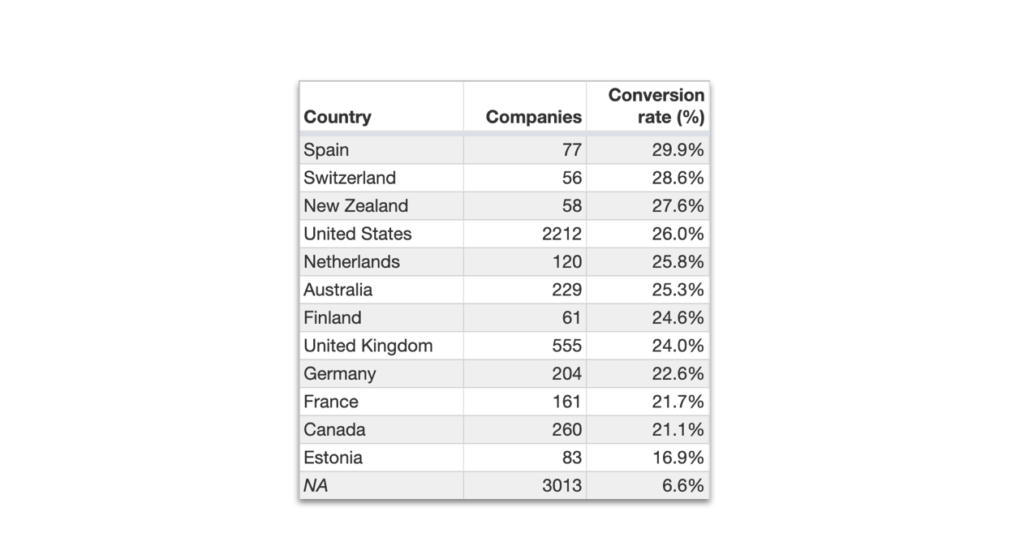
Denmark with its record high conversion rate is off the table, and there are only European and North American countries in the top – best-converting regions for SaaS and non-app e-commerce.
At the bottom of the list is NA, which stands for not available, not North America. The biggest bucket in terms of locations, roughly 35% of all companies added to our CRM, is one where Clearbit wasn’t able to determine a location. And it seems that a mere 6.6% of signups like this convert to paid, nearly 3 times less than our average.
It’s worth pointing out that NA includes accounts created with a non-work email address such as gmail.com. These accounts tend to convert to paid at a notably lower rate but this doesn’t explain such a dramatic difference.
How accurate and useful is industry data (from Clearbit)?
Secondly, let’s see how conversion varies across industries (industries according to Clearbit, that is).
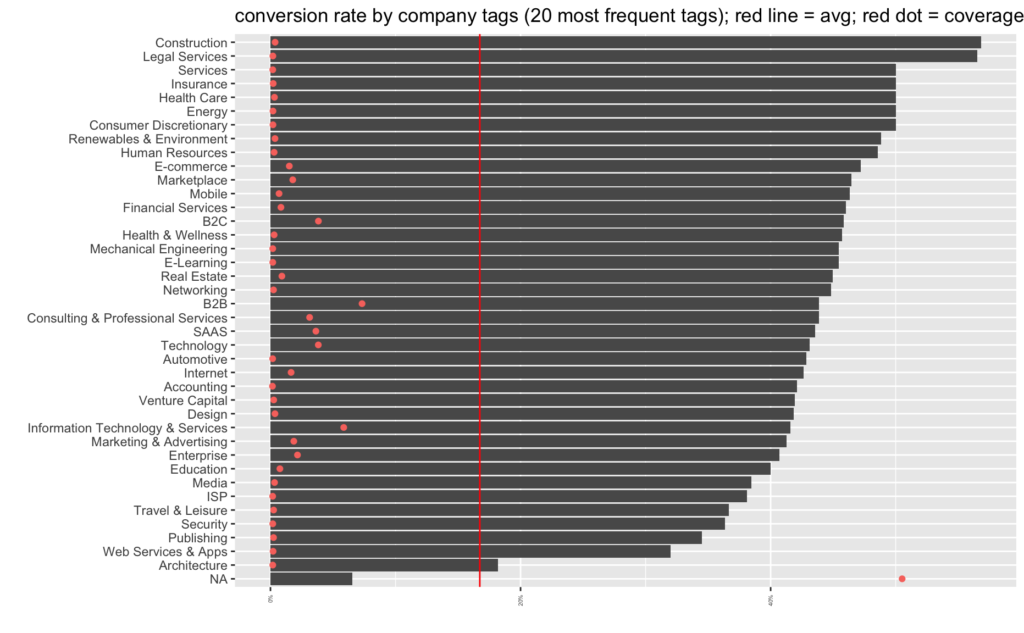
At first glance, this seems to be useful. If the industry of a new lead is “construction”, we’ll be converting a whopping 56% of them! And from the bottom rows, “web services and apps” has “only” a 32% conversion to paid.
So the first thing that’s a bit odd is that all industries have a higher conversion to paid than our average (the red line on the graph).
The second thing to notice is the volume of companies in each of the industries, as indicated by the red dot. For most, the volume of companies is very small. In the “construction” bucket there are only 44 companies, in “web services and apps” there are 25.
My armchair-statistician rule of thumb is that you should always ignore conclusions that are based on fewer than 100 data points. If I do this to our data set, I’ll get the following table.
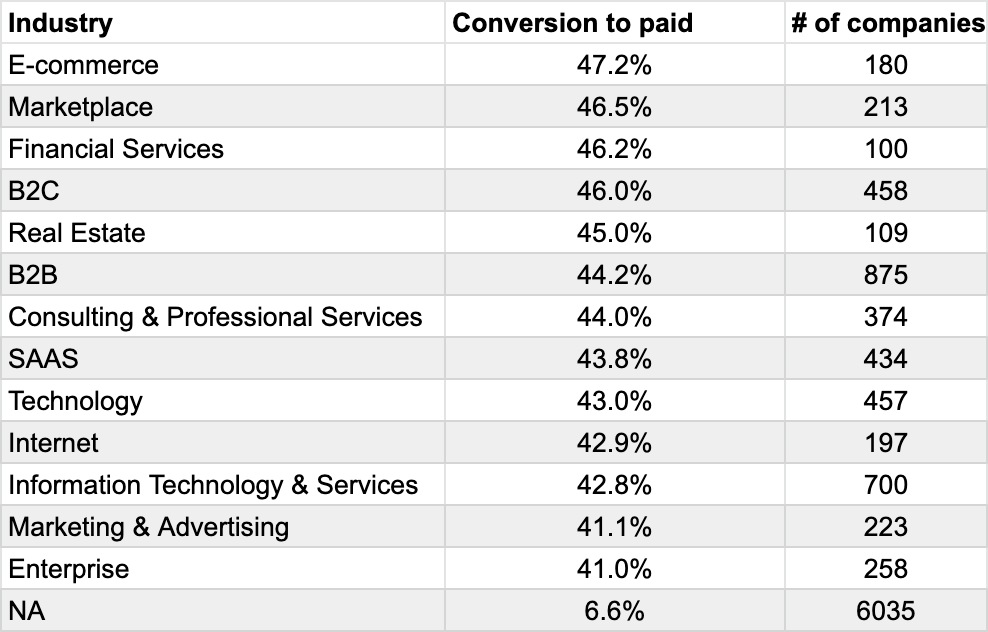
So it seems that if Clearbit can add any vertical to a company at some scale, we’ll be able to convert at least 40% of them to pay, more than double our average.
And if Clearbit can’t add any industry (which is the case for 75% of our leads), the conversion rate is a mere 6,5%.
Converting any vertical at 40% or more sounds suspiciously high. But let’s look at one more variable before making any conclusions.
How useful is enriching leads with revenue data
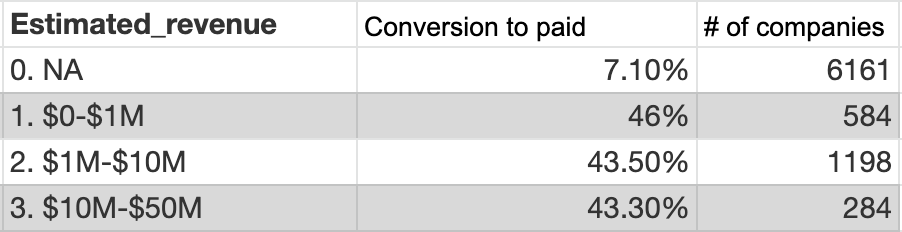
Clearbit handily provides information about the estimated annual revenue of companies: less than a million, 1-10 millions, 10-50 millions, etc. (all US dollars).
Unfortunately, a similar picture emerges here. In the six buckets where the annual revenue is more than $50 million, there are very few data points (between 4 and 30 companies in each of the buckets).
And in the revenue ranges where there are more data points, the conversion rate remains north of 40% consistently. But for the 73% or so of our leads where revenue data was not provided, conversion to paid is a mere 7.1%.
What about enriching data with employee count? Alexa rank?
These two variables gave us very similar results.
When any Alexa rank or employee count range is provided, conversion to paid is always more than 40%. And where Clearbit hadn’t provided any data, the conversion rate ranges between 5-7%.
What does this mean? Is data enrichment useful or not?
Hard to tell conclusively.
One thing that’s clear is that Clearbit’s coverage is not high enough for a company like us, selling mostly to small businesses and selling globally, not just in North America. The coverage is a decent 65% for variables like the location but a mere 25% for the really interesting data points like employee count or estimated revenue.
One possible explanation is that the data accuracy of Clearbit may not be high enough in our segment, SMB companies around the world. That seems to be probable, given the results across many firmographic variables where any data provided resulted in converting 40+% of leads but leads without any data provided converted at 6-7%.
Another explanation: perhaps 8000 data points are too few to be able to draw any conclusions about the accuracy and usefulness of data enrichment. Perhaps we need more scale.
And one more theory: perhaps we’re a unique breed of a company where some factor X is much more important than traditional firmographics data when it comes to defining which are the “good” leads.
Whatever the case, we learned that Clearbit’s data enrichment is only partially useful for a company like Outfunnel. We’ll still continue using Clearbit because it helps us avoid one field in our signup flow and provides useful context for a subset of the leads we interact with.
Want to test the usefulness of data enrichment on your data?
We’re currently working on some Outfunnel features that would let you analyze leads and lead sources. We’re recruiting customers who’d like insights like those above based on their customer data.
Best suited for Outfunnel customers, but we can work with any company using Pipedrive, Copper, Hubspot, or Salesforce. Get in touch if this sounds interesting.